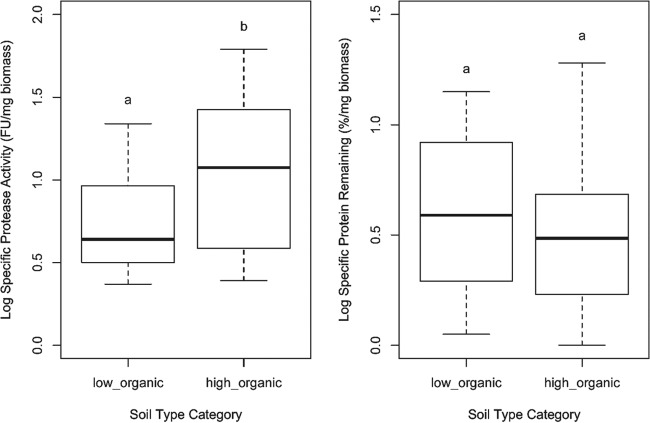
FIG 2.
Box-and-whiskers representation of log-transformed values of specific protease activities and specific protein degradation of the 55 Suillus strains categorized by soil type. Different letters indicate significant differences among treatment soil type means as determined by post hoc Tukey HSD tests. The boxes represent the 2nd and 3rd interquartile ranges; the horizontal lines in the boxes represent the median; the upper and lower bars outside the boxes represent the 1st and 4th quartiles, respectively.

