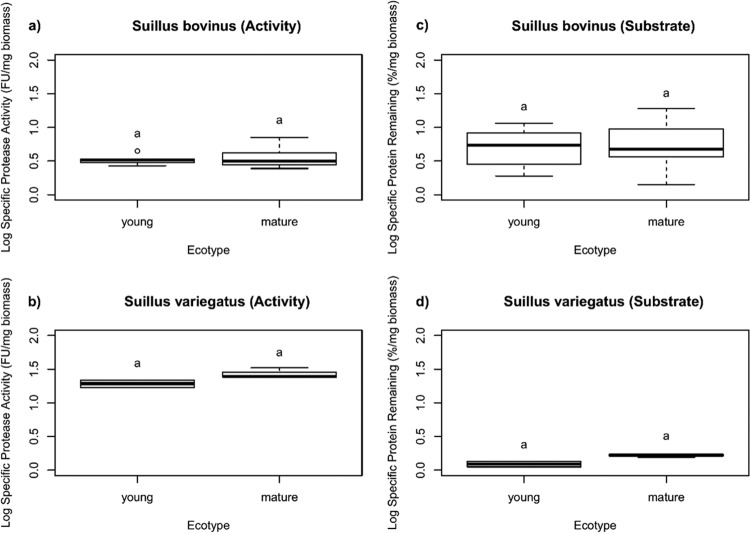
FIG 3.
Box-and-whiskers representation of log-transformed values of specific protease activities and specific protein degradation of strains of S. bovinus and S. variegatus isolated from two forest sites: a young forest with soil with a low organic N/mineral N ratio (Paal) and a mature forest with soil with a high organic N/mineral N ratio (Zolder). The box plots represent the variation of each parameter between species (S. bovinus, 6 strains in Paal and 7 in Zolder; S. variegatus, 2 strains in Paal and 3 in Zolder). The boxes represent the 2nd and 3rd interquartile ranges; the horizontal lines in the boxes represent the median; the upper and lower bars outside the boxes represent the 1st (Q1) and 4th quartiles, respectively; and the dots outside the bars represent the outliers (defined as values outside 1.5 times the interquartile range below Q1 and above Q3).

