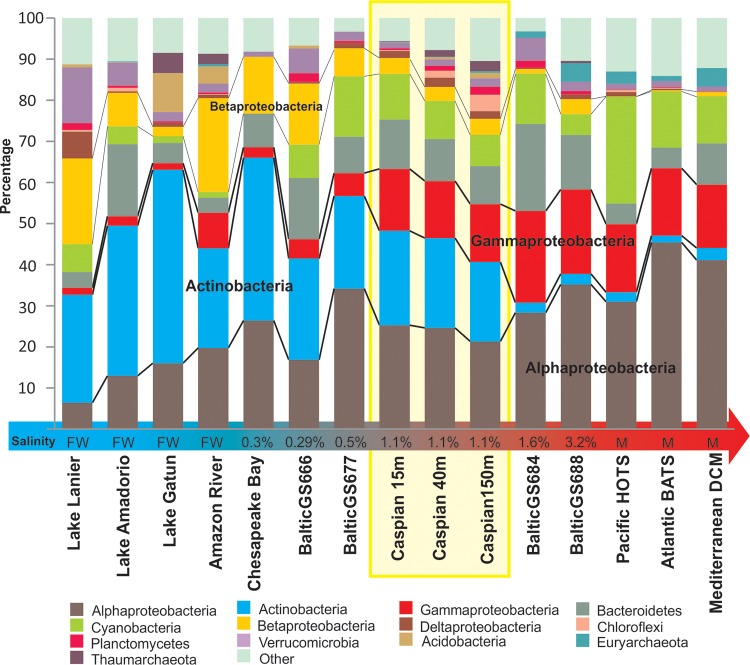
FIG 1.
Prokaryotic community structure based on 16S rRNA gene reads from unassembled data sets from the Caspian Sea depth profile in comparison to that based on 16S rRNA gene reads from freshwater, marine water, and brackish water data sets. Marine photic zone data sets include HOTS (Hawaii Ocean Time-series; depth, 25 m), BATS (Bermuda Atlantic Time-series; depth, 20 m), and the Mediterranean DCM (deep chlorophyll maximum; depth, 55 m) (68, 83, 99), and freshwater data sets include those for Lake Lanier, Lake Amadorio, and Lake Gatun together with the Amazon River (81, 100–102). For intermediate salinities, Chesapeake Bay (101) and Baltic Sea (5) salinity gradient data sets were used. The salinity of brackish habitats is indicated at the base of each column (FW, freshwater [0% salinity]; M, marine water [ca. 3.5% salinity]).

