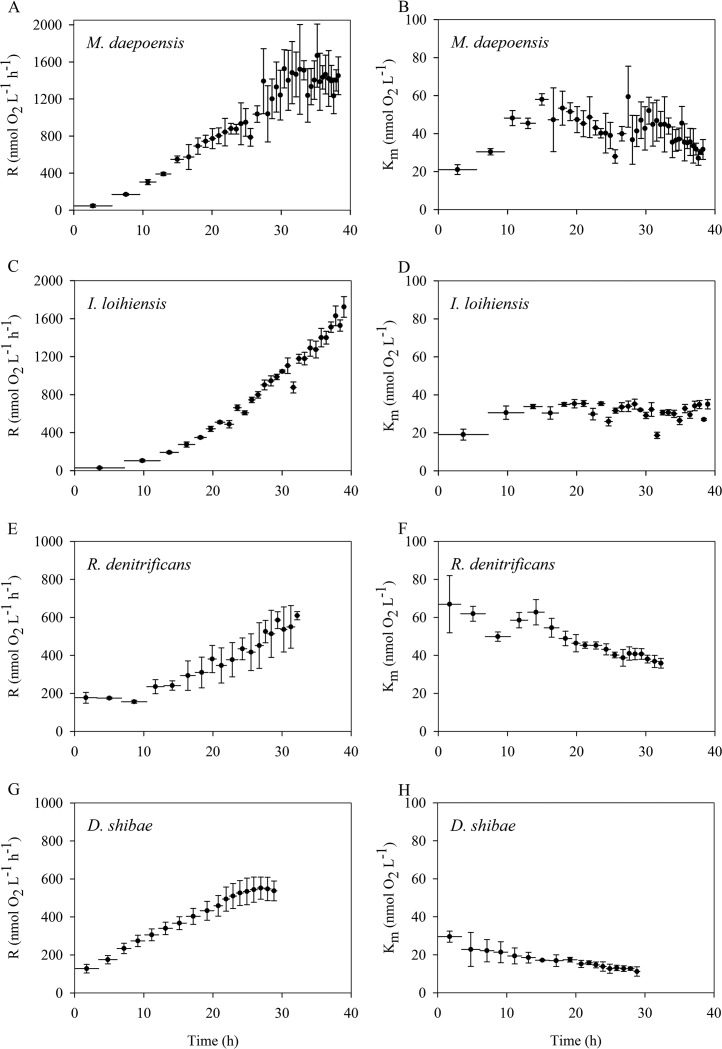
FIG 3.
Time course of the respiration rates (R) of the population (A, C, E, and G) and apparent Km values (B, D, F, and H) for four species, M. daepoensis (A and B), I. loihiensis (C and D), R. denitrificans (E and F), and D. shibae (G and H), during incubation under non-energy-limited conditions. Values are means ± SDs (n = 3 or 4). Horizontal bars represent time periods. Note the differences in the y-axis scales in the left panels (A, C, E, and G).

