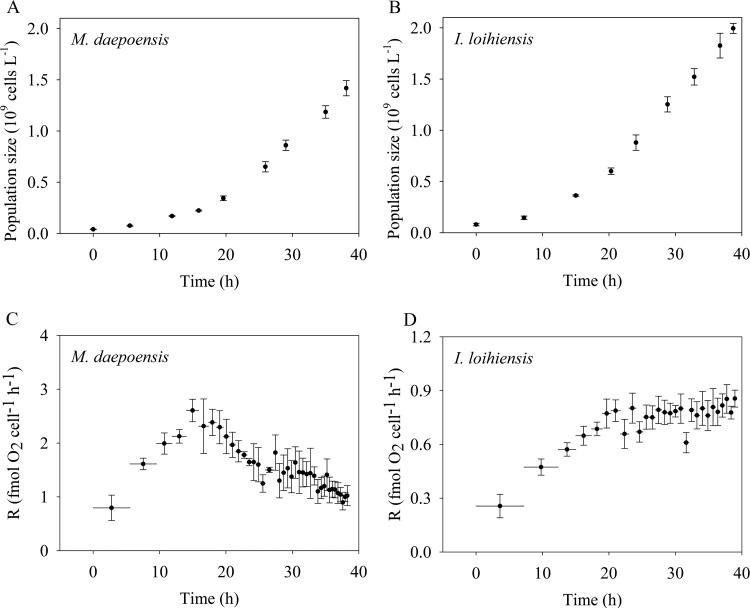
FIG 5.
Time courses of population size (A and B) and the respiration rate per cell (R) (C and D) of M. daepoensis and I. loihiensis during incubation under non-energy-limited conditions. Values are means ± SDs (n = 3 to 4). The horizontal bars (C and D) represent time periods. Note the differences in the y-axis scales in the bottom panels (C and D).

