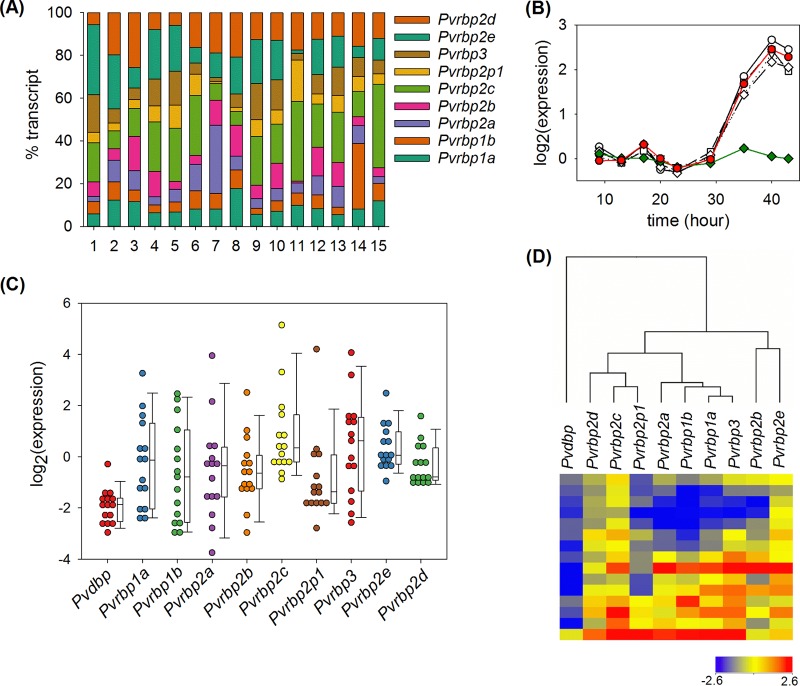
FIG 3.
(A) Distribution of Pvrbp transcript abundances in 15 P. vivax malaria patient samples. Each stacked bar represents the transcript copy number normalized by the sum of all Pvrbp gene transcripts in each patient. Data for individual genes are arranged from top to bottom as indicated. (B) The average time courses of transcript abundance during the blood stage life cycle were constructed from published microarray data (22). Red circles, Pvama1; open circles, Pvrbp1a; open triangles, Pvrbp2a; open squares, Pvrbp2b; open diamonds, Pvrbp2c; green diamonds, a housekeeping gene encoding methionine tRNA ligase (PVX_110980). Each time course was baseline subtracted with the average log2(expression) during the first 30 h. (C) Distribution of Pvama1-normalized transcript copy numbers of Pvdbp and Pvrbp genes. Each circle represents data from a single patient. The whiskers on the box plots indicate the 10th and 90th percentiles. (D) Heat map and clustering of Pvama-1-normalized expression based on the Pearson correlation coefficient. Each row of the heat map represents data from a single patient.

