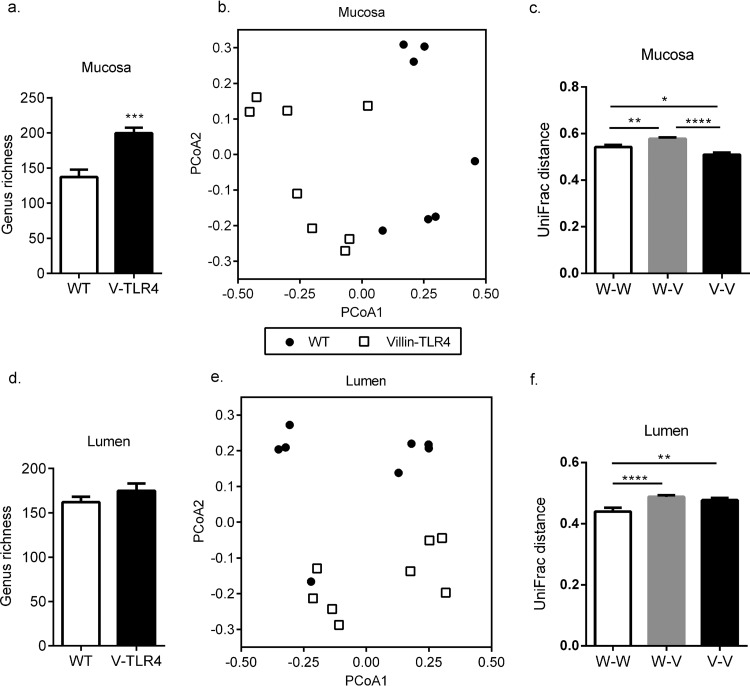
FIG 2.
Epithelium-specific TLR4 expression changes the composition of the colon microbiota. To calculate bacterial richness, total numbers of OTUs at the genus level were determined by Illumina 16S rRNA gene sequencing of mucosa (a) and lumen (d) samples from the distal colons of villin-TLR4 and WT littermates (***, P < 0.001 by Student's t test). PCoA based on unweighted UniFrac distances between OTUs detected in the mucosa (b) and lumen (e) were used to generate ordination plots for viewing of the relative positioning of villin-TLR4 (open squares) and WT (filled circles) littermate mice in two dimensions. The values in parentheses indicate the percent variation explained by the axis. Mean UniFrac distances for each WT mouse versus every other WT mouse (W-W), each WT mouse versus every villin-TLR4 mouse (W-V), and each villin-TLR4 mouse versus every other villin-TLR4 mouse (V-V) are plotted for mucosal (c) and luminal (f) samples (*, P < 0.05; **, P < 0.01; ****, P < 0.0001 by one-way ANOVA and Tukey's post hoc test). Mean values ± the standard errors of the means of seven or eight mice per group are shown.

