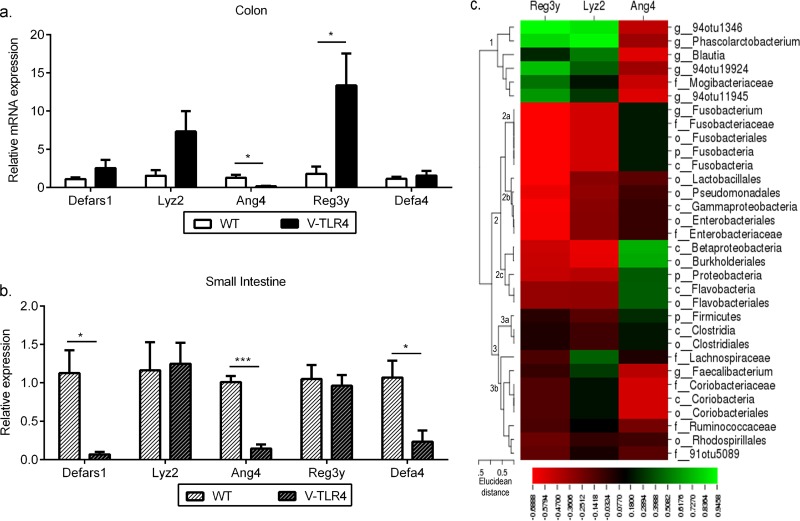
FIG 4.
Expression of AMP genes in the colon and small intestine is distinctly regulated by epithelial TLR4. Relative mRNA expression levels of AMP genes in ECs isolated from the colons (a) and small intestines (b) of villin-TLR4 and WT mice are shown. Results represent the mean ± the standard error of the mean of relative mRNA expression normalized to GAPDH and β-actin. *, P < 0.05; ***, P < 0.001 by two-tailed Student's t test (four or five mice per group). (c) Pearson coefficients of correlation between selected AMP genes and bacterial OTUs were both negative and positive. The Pearson correlation coefficients (r values) obtained for each AMP gene and selected bacterial OTUs were mapped by a one-matrix heat map with CIMminer. The scale bar, from left to right, represents negative correlations in red to positive correlations in green. Bacterial OTUs were clustered by Euclidean distance. Clusters and subclusters are labeled at their nodes.

