FIG 9.

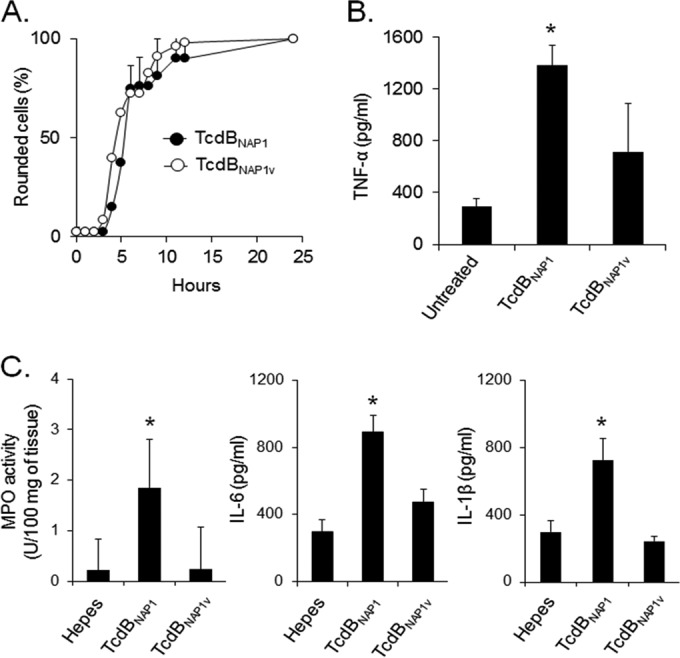
TcdBNAP1V has the same cytotoxic potency as TcdBNAP1 but induces fewer proinflammatory reactions. (A) HeLa cells were treated with equal concentrations (10 pM) of purified TcdBNAP1 and TcdBNAP1V. The percentage of cells showing a toxin-induced CPE was calculated at the indicated times. (B) RAW cells were incubated for 6 h with equal concentrations (0.5 nM) of purified TcdBNAP1 and TcdBNAP1V. After incubation, the amount of TNF-α released in the supernatant was determined by ELISA. Each bar represents the mean ± standard deviation from three independent experiments. (C) Mouse ligated ileal loops were inoculated with 10 μg of purified TcdBNAP1 and TcdBNAP1V for 4 h. After treatment, MPO activity and inflammatory cytokine (IL-1β and IL-6) levels were determined. Means ± standard deviations, n ≥ 5. *, P < 0.05, compared to the groups without asterisk (one-way analysis of variance with Bonferroni's correction).
