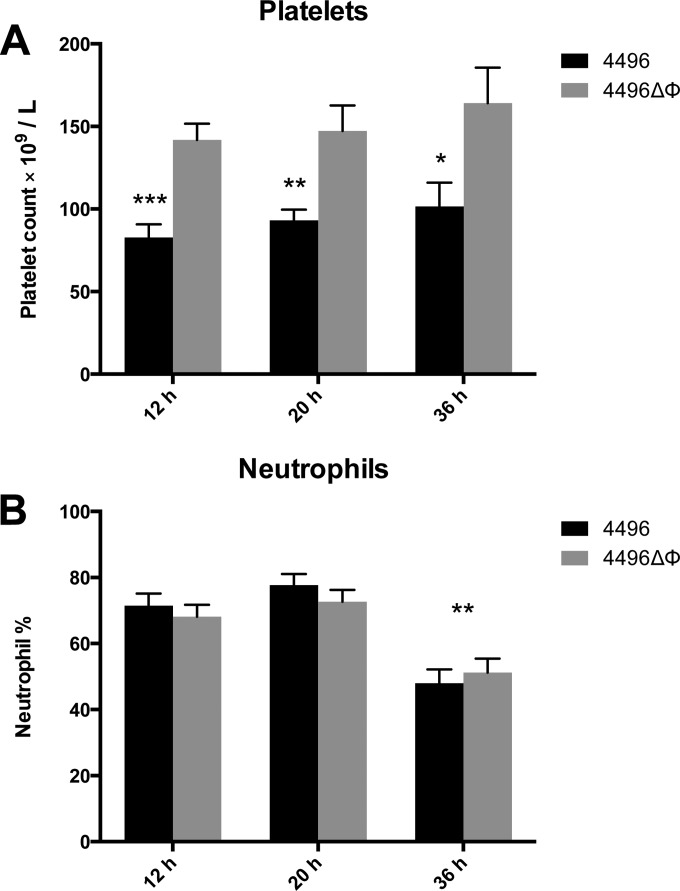
FIG 5.
Platelet and neutrophil counts in the peripheral blood of strain 4496 and 4496ΔΦ mutant-infected mice. (A) Data are platelet counts ± SEM (n = 8 at 36 h; n = 10 at 12 h and 20 h) post-i.n. challenge. (B) Data are neutrophil counts (means ± SEM; n = 10) for each challenge group, expressed as percentages of total white blood cells. Statistical differences were analyzed by two-tailed unpaired t tests (*, P < 0.05; **, P < 0.01; ***, P < 0.001).

