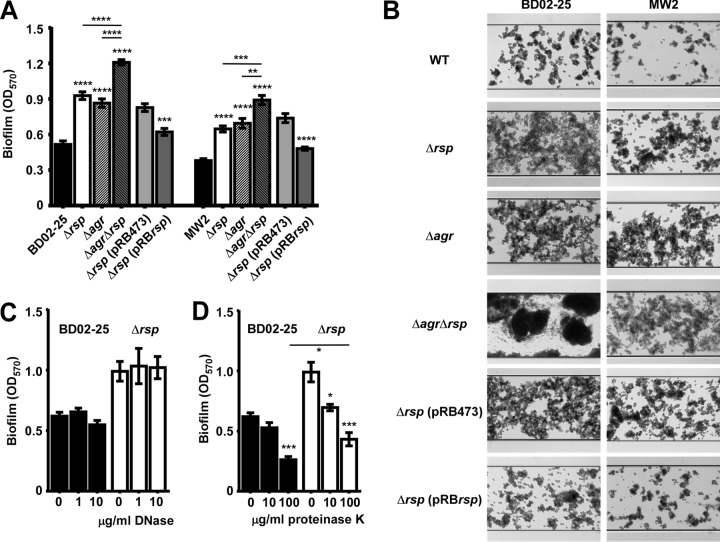
FIG 2.
Impact of Rsp on biofilm formation. (A) Biofilm formation in microtiter plates. Data are from 6 independent measurements. The wild-type and isogenic mutant strain data were compared by 1-way ANOVA; data were obtained from plasmid-harboring control and rsp-complemented strains by unpaired t tests. Asterisks depict the statistical significance for comparison to the wild-type strain unless indicated by horizontal bars. **, P < 0.01; ***, P < 0.001; ****, P < 0.0001. (B) Biofilm formation in microfluidic flow cells. (C, D) Degradation of BD02-25 and isogenic rsp mutant biofilms by DNase (C) and proteinase K (D). Comparisons were evaluated by 1-way ANOVA. Asterisks depict the statistical significance for the comparison to the bar labeled “0” (no enzyme added), unless indicated by horizontal bars. *, P < 0.05; ***, P < 0.001. Error bars depict ±SEM.

