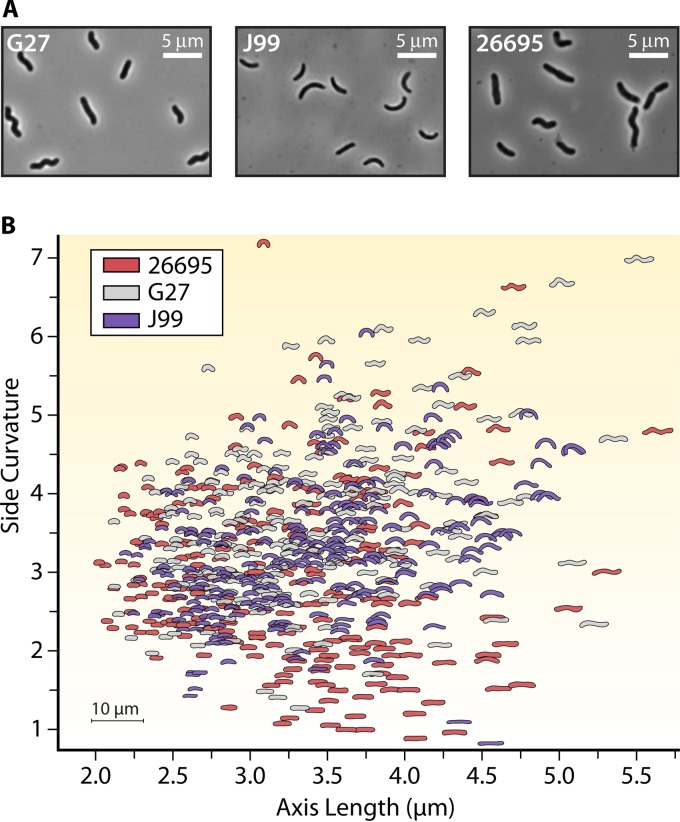
FIG 3.
Helicobacter pylori intraspecies cell shape heterogeneity. (A) Phase-contrast images of three clinical strains of Helicobacter pylori (188–190). (B) Quantitative Celltool scatterplot analysis (19) showing cell side curvature versus axis length for clonal populations of the indicated strains of H. pylori (>100 cells/strain).

