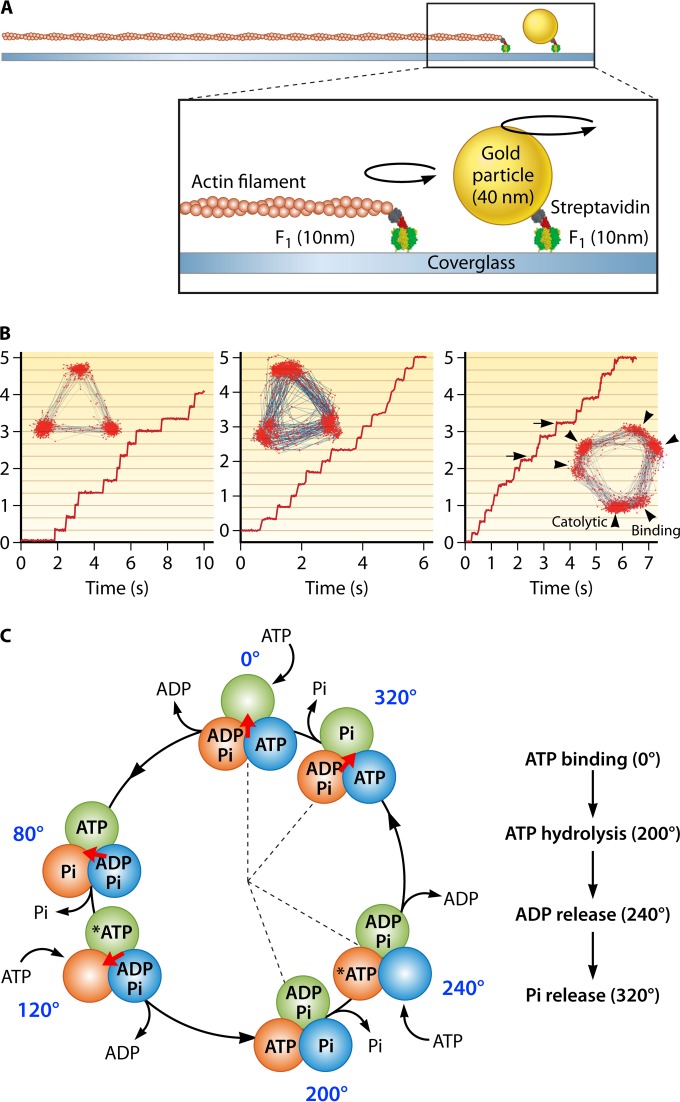
FIG 19.
Single-molecule rotation of F1. (A) Schematic image of the experimental setup. The α3β3 ring is fixed on the glass surface. A probe (fluorescently labeled actin filament or 40-nm colloidal gold) is attached to the γ subunit. (B) Left, rotation of F1 with 3 binding pauses separated 120°, which is caused by slow ATP binding at 200 nM. The inset shows the trajectory of the rotation. Center, rotation of a mutant F1 (βE190D) with 3 catalytic pauses at 2 mM ATP. Each pause is caused by the extremely slow ATP hydrolysis by the mutant. Right, rotation of mutant F1 (βE190D) at 2 μM ATP. Due to slow ATP binding and hydrolysis, 6 pauses are observed. The pauses before the 80° (arrowheads) and 40° (arrows) substeps correspond to binding and catalytic pauses, respectively. (C) Chemomechanical coupling scheme. Each circle indicates the chemical state of the catalytic sites. One catalytic site is highlighted in dark green. The central arrow (red) represents the angular position of the γ subunit. Each catalytic site retains the bound nucleotide as ATP until the γ subunit rotates 200° from the binding angle (0°). After a 200° rotation, the catalytic site executes the hydrolysis of ATP into ADP and Pi, each of which is released at 240° and 320°, respectively.

