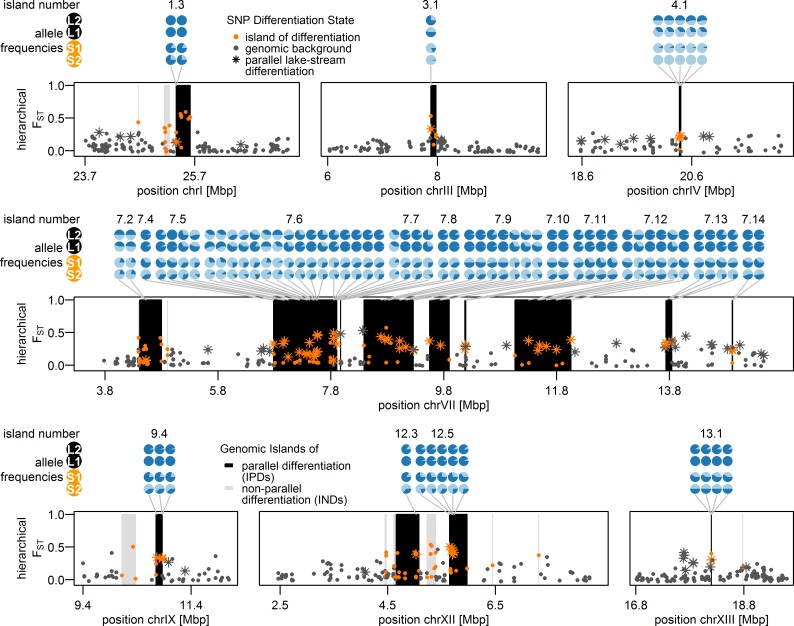
Fig 5. Allele frequencies of parallel lake-stream differentiation SNPs in 19 islands of parallel lake-stream differentiation.
Pie charts represent allele frequencies at the sites S1, S2, L1 and L2 of parallel divergent SNPs within parallel islands. Light and dark blue segments show the respective proportions of stream-like and lake-like alleles at those sites. Star-like dots show SNPs indicative of parallel lake-stream differentiation, while color coding of dots and vertical bars are as in Fig 4.

