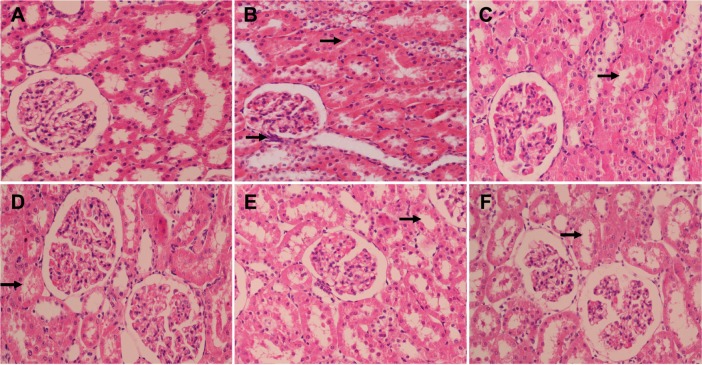
Figure 4.
Representative micrographs of kidney tissue stained with hematoxylin–eosin.
Notes: Arrows show vacuolar degeneration of proximal tubules. (A) NC group, (B) DC group, (C) Met group, (D) TSD-40 group, (E) TSD-80 group, and (F) TSD-160 group.
Abbreviations: NC, normal control group; DC, diabetic control group; Met, metformin hydrochloride group; TSD, total saponin of Dioscorea hypoglaucae Palibin.

