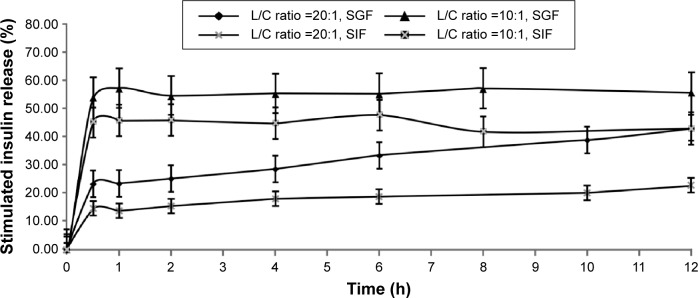
Figure 3.
In vitro time-dependent release profiles of insulin-loaded lecithin/chitosan nanoparticles with different L/C ratios.
Note: The data are presented as the mean ± SD (n=3).
Abbreviations: L/C, lecithin/chitosan; SD, standard deviation; SGF, simulated gastric fluid; SIF, simulated intestinal fluid.

