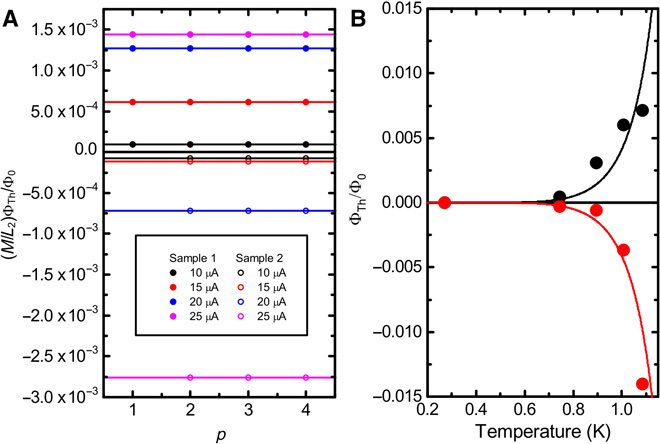
Fig. 3. Thermoelectric phase shifts and magnetic flux at different heater currents and hot contact temperatures.

(A) The values of ΔBn,k versus p at different k and n values close to the line ΔBn,k = 0 in Fig. 2E with Λ effect excluded. (B) The measured thermoelectric flux values at different hot spot temperatures for two samples with opposite direction of the temperature gradient (symbols). Curves are theory predictions according to Eq. 2.
