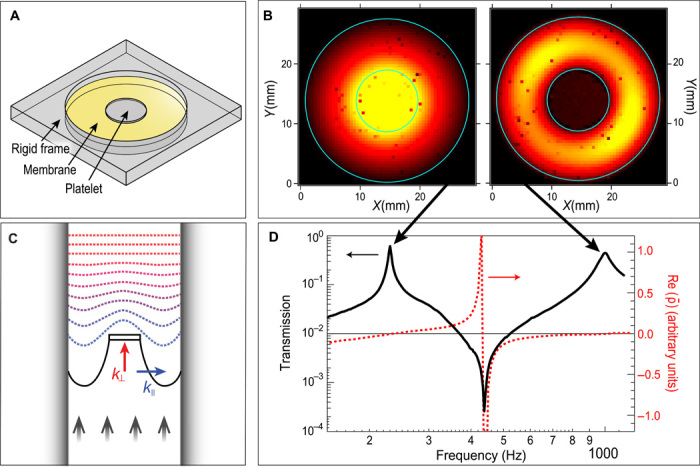
Fig. 3. Single membrane with negative effective mass density.

(A) A schematic drawing of a typical DMR (36). (B) Out-of-plane displacement amplitude |W(x)| of the low-frequency eigenmodes (measured with a laser Doppler vibrometer) of two DMRs (194). Light yellow indicates a large normal displacement amplitude, whereas darker colors indicate small or no normal displacement. Cyan circles delineate the edge of the membrane and the position of the platelet. The first mode is characterized by the large up-and-down oscillation of the platelet, pulling along the entire structure (left). In the second mode, the platelet is almost motionless (right), and the oscillation amplitude is largest in the surrounding membrane. (C) A schematic illustration indicating that, as a result of the deep-subwavelength size of the DMR, the large in-plane wave vectors k∥ only contribute to evanescent waves (blue dashed lines), owing to the fact that the lateral fast variations of the up-and-down displacements tend to cancel each other in air, and the net amplitude decays exponentially as a result. The far-field propagating wave is determined by the k⊥ of the surface-averaged component of the normal displacement (red dashed lines). In the system shown here, the DMR (black) is blocking a one-dimensional waveguide, and a planar sound wave impinges from the bottom. The reflected field is not shown. (D) Measured amplitude transmission coefficient of a DMR (black solid curve, left axis) and the real part of the calculated effective mass density (red dashed curve, right axis). Various features are explained in the text.
