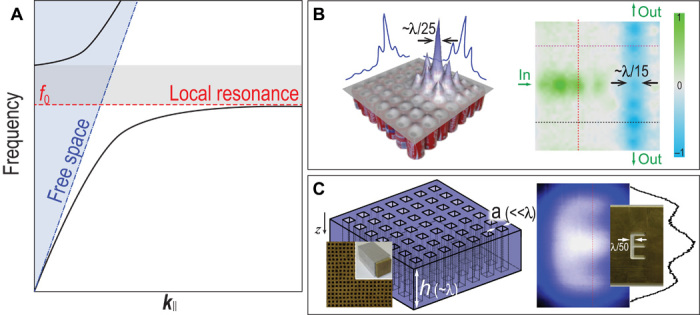
Fig. 5. Superresolution with local resonances.

(A) The type of dispersion relation that is commonly used for superresolution and deep-subwavelength focusing with acoustic metamaterials. Here, the blue dotted-dashed line is the “sound line” (that is, the dispersion of acoustic wave in the homogeneous background medium), and the red dashed line is that of the local resonance with eigenfrequency f0. Coupling between the two induces anticrossing in the vicinity of f0 and gives rise to the dispersion delineated by the two black curves. The region shaded in gray is a bandgap. In free space, only the k components within the blue-shaded region are accessible. However, for the lower branch, the k components much larger than those available in free space (the blue-shaded region) become accessible. (B) Superresolution focusing (left; showing the pressure distribution) and subwavelength wave guiding (right; showing the normalized pressure amplitude) achieved by using a two-dimensional array of air-filled cavity resonators (soda cans). The resonances of the soda cans yield a dispersion, as shown in (A) (47, 48). (C) A two-dimensional array of subwavelength waveguides is shown on the left. The thickness of the lens h is the same as the operating wavelength in air (not drawn to scale in this schematic drawing). These waveguides can support Fabry-Pérot resonances that have flat dispersions, which are useful for achieving superresolution imaging (49, 50). In the imaging result shown on the right, light color represents stronger pressure intensity. The object is in the shape of the character “E” (inset). The stroke width of “E” is ~λ/50. The lens is placed close to the object, and an image is formed on the other side, where the shape “E” can be recognized (50).
