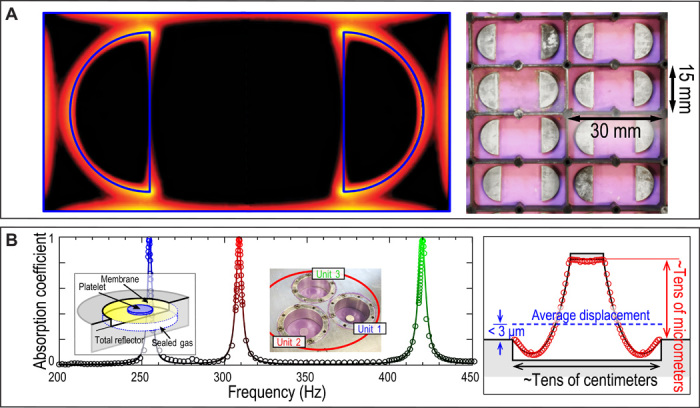
Fig. 8. Acoustic absorption by DMRs.

(A) Left: Numerically simulated elastic bending energy density of a soft membrane decorated with rigid platelets, delineated by blue curves. Light color represents high energy density. The energy is highly concentrated in the small areas along the perimeters of the platelets and along the sample boundary (119). Right: A photographic image of such a membrane absorber. (B) Total absorption of low-frequency sound at multiple frequencies using hybrid resonances. The left panel shows the absorption coefficient of a three-unit membrane metasurface (structure shown in the right inset). The markers are measured data, and the solid curve represents simulation. The membrane metasurface unit cell comprises a stretched membrane decorated with a rigid platelet, backed by a thin layer of sealed gas (thickness expressed in centimeters). The hybrid resonance structure is fabricated on top of a hard reflecting surface (left inset). The right panel of (B) shows the vibration profile of the membrane at the hybrid resonant frequency. Red markers represent experimentally measured data. The surface-averaged normal displacement (blue dashed line; not drawn to scale) matches the amplitude of the incident sound—an indication of impedance matching. However, the normal displacement can be much larger locally, suggesting a very large energy density in the form of the deaf component that couples only to evanescent waves (120).
