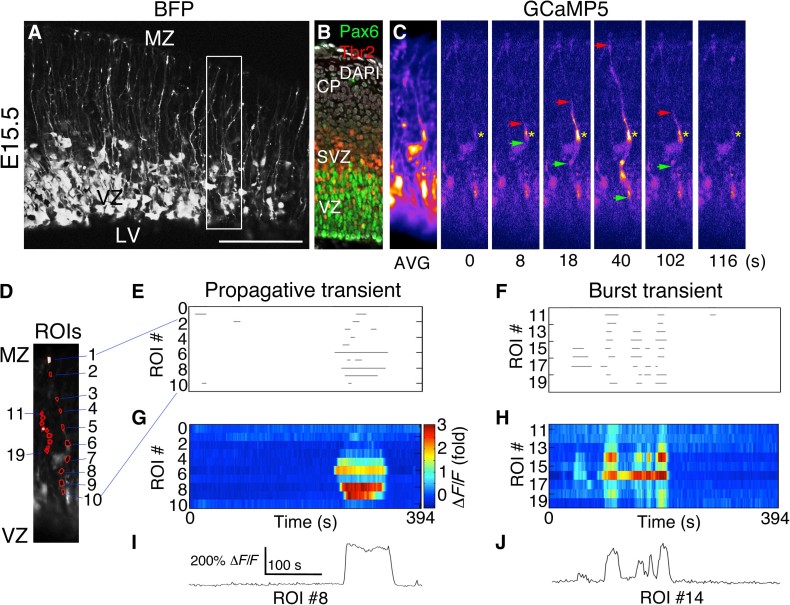
Fig. 1. PCTs in RGC fibers during neurogenesis.
(A) Blue fluorescent protein (BFP) Z-stack of a live E15.5 mouse cortical slice from an embryo coelectroporated with pCAG-BFP and pCAG-GCaMP5G at E14.5. (B) Immunohistochemistry to visualize VZ and SVZ (subventricular zone) at the time of electroporation. DAPI, 4′,6-diamidino-2-phenylindole. (C) Time-lapse images corresponding to the boxed region in (A) showing a Ca2+ transient originating in an RGC fiber segment (yellow asterisk) and propagating bidirectionally (red and green arrows). AVG, average. (D) Regions of interest (ROIs) corresponding to two separate Ca2+ events in the same movie, drawn in MATLAB. (E to H) Ca2+ event properties were extracted from Ca2+ movies and rendered as rasterplots or heat map intensity plots. (I and J) Ca2+ activity traces for individual ROIs showing single or burst Ca2+ transients in RGC fibers. LV, lateral ventricle; MZ, marginal zone. Scale bars, 125 μm (A) and 100 μm (B and C).

