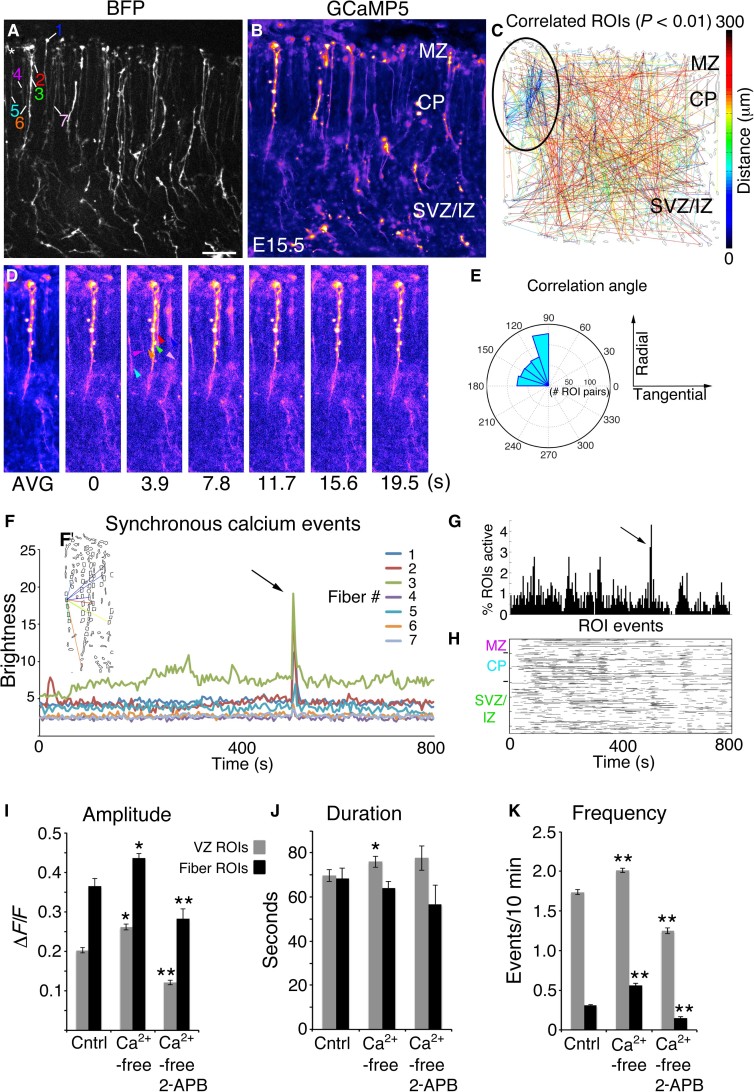
Fig. 3. Radial glial fibers form synchronous activation groups.
(A) BFP Z-stack of an E15.5 cortical slice. (B) Averaged GCaMP5 movie. (C) Correlation map; clustered correlations indicated by black oval. (D) Time-lapse series; coherently active RGC fibers are indicated by colored arrowheads. (E) Correlation angles from correlated pairs in (C) binned and plotted on polar coordinates. (F) Absolute brightness traces from ROIs of coherently active RGC fibers. (F’) Correlated pairs within the synchronous cluster. (G and H) Extraction of Ca2+ event properties in MATLAB revealed the synchronous firing event in percent active and rasterplot form. (I to K) RGC cell body (gray bars) and fiber (black bars) activity in control (Cntrl) ACSF, Ca2+-free ACSF, and Ca2+-free ACSF plus 100 μM 2-APB. *P < 0.05; **P < 0.001, t test. Error bars, mean ± SEM. Scale bar, 40 μm.

