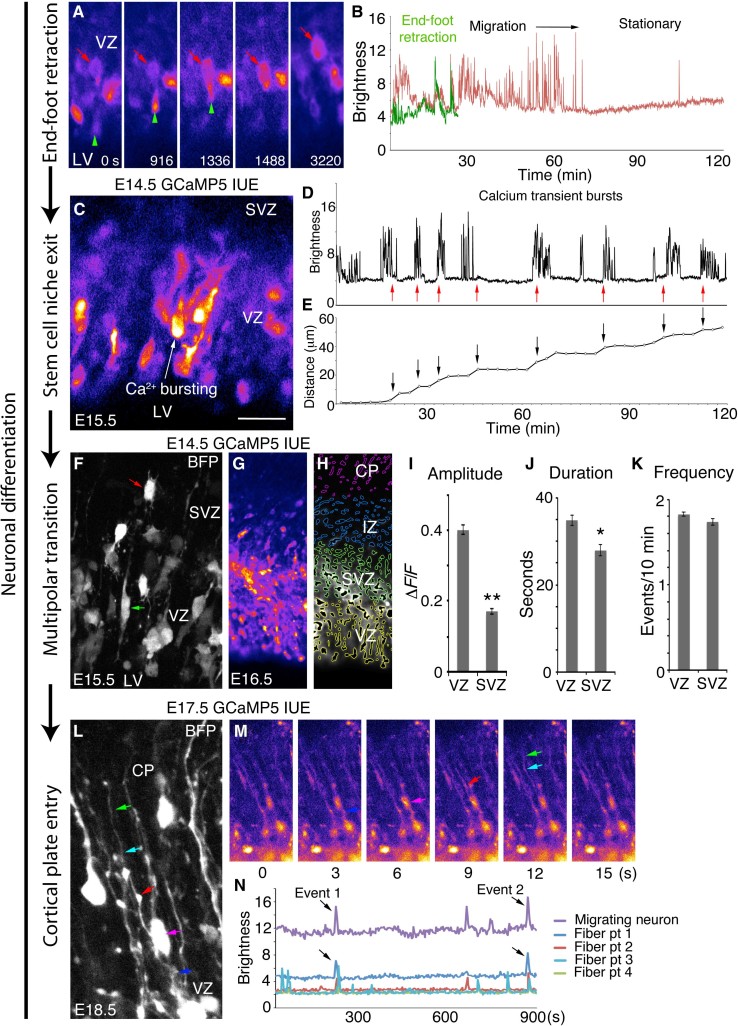
Fig. 4. Bursting calcium activity in newborn migrating neurons and communication with RGC fibers.
(A) Retracting apical end foot (green arrowhead) and its cell body (red arrow). (B) Calcium activity traces of the cell in (A). (C) Putative migrating neuron exiting the VZ. (D) Calcium bursting activity (red arrows) of cell indicated in (C). (E) Distance traveled by cell in (C) (arrows) corresponding to Ca2+ bursts in (D). (F) BFP Z-stack showing electroporated RGCs (green arrow) and multipolar progenitors (red arrow). (G) GCaMP5G image of an E16.5 cortical slice after E14.5 electroporation. (H) MATLAB ROIs organized in embryonic zones corresponding to the image in (G). (I to K) Ca2+ activity properties of the VZ and SVZ. (L) BFP Z-stack of an RGC fiber (dark blue, red, light blue, and green arrows) and adjacent migrating neuron (magenta arrow) at E18.5. (M) Time-lapse GCaMP5 images of the cell in (L). (N) Correlated Ca2+ activity of the RGC fiber and neuron in (L) and (M). *P < 0.05; **P < 0.001, t test. Error bars, mean ± SEM. Scale bars, 25 μm (A, C, F, and L) and 80 μm (G and H).

