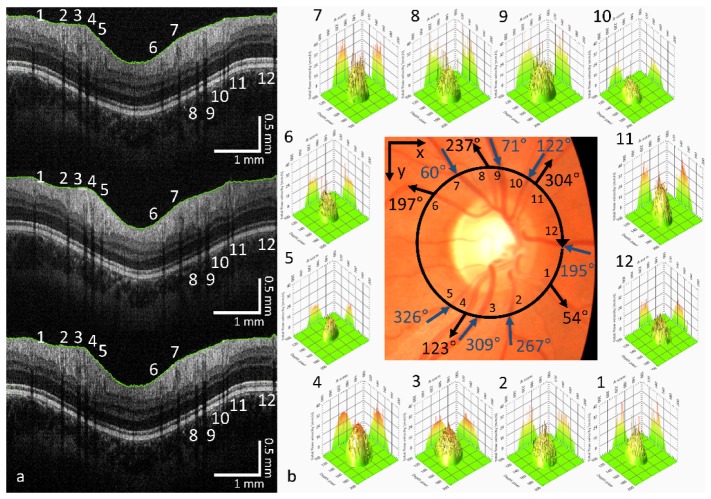
Fig. 7.
3-D velocity profile evaluation. (a) single circular B-scan for every channel, consisting of 6144 A-scans each. White numbers, vessel numbering. Green lines, segmentation lines for phase offset subtraction. (b, center) Color fundus photo. Black circular arrow indicates the direction and the path of the circular scan. Black inner numbers: Vessel numbering. Arrows with numbers: calculated vessel orientation from the 3 beam D-OCT data. (b, surrounding) Reconstructed velocity profiles for the corresponding vessels around the ONH after phase offset subtraction, phase unwrapping and averaging over 10 B-scans. x-axis: A-scans (200, zoomed view on the vessel location, steps of 40), y-axis: Depth pixel (100, steps of 20), z-axis: Velocity (mm/s, 0 - 40, steps of 8).

