
Fig. 8.
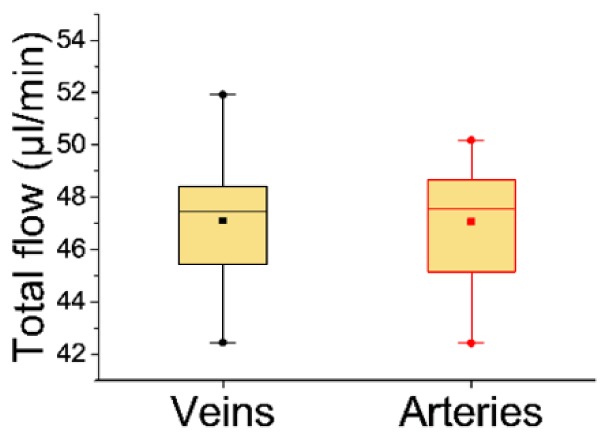
Box-Whiskers plot of the total retinal mean blood flow (20 eyes) in veins and arteries. Filled square: Average. Horizontal line: Median. Filled circles: Maximum and minimum measured flow. Box: 25th and 75th percentile. Whiskers: 1.5 times the interquartile distance – ( + ) the 25th (75th) percentile. If this value is smaller (greater) or equal to the smallest (largest) value in the data set, the whisker is drawn at this position.