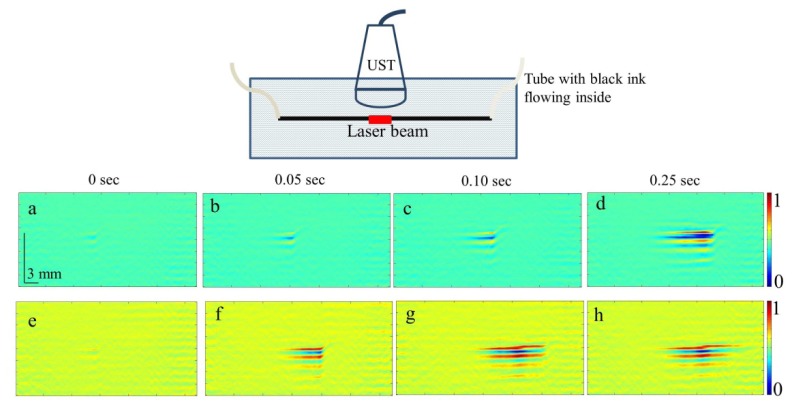
Fig. 3.
Set of PA images showing the ink flow at various time points obtained with PLD-PAT system. PA imaging was done at a frame rate of 3500 fps. Schematic of the setup is shown on the top. (a-d) Flow rate was 3 cm/s, (e-h) flow rate was 14 cm/s. All images have same scale bars shown in (a). The normalised colormap is shown on the right. Movie clips (Visualization 1 (8.5MB, MP4) , Visualization 2 (5MB, MP4) , Visualization 3 (4MB, MP4) , and Visualization 4 (3.3MB, MP4) ) show the ink flowing through the tube with 3500 fps PA B-scan imaging.

