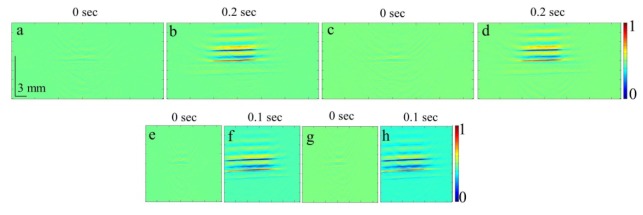
Fig. 5.
Set of PA images showing the ink flow at various time points as obtained by OPO-PAT system. (a-d) PA imaging was done at a frame rate of 5 fps and (e-h) at a frame rate of 10 fps. (a,b,e,f) Flow rate was 3 cm/s, (c,d,g,h) flow rate was 14 cm/s. All the images have same scale bars as shown in (a). The normalized colormap is shown on the right.

