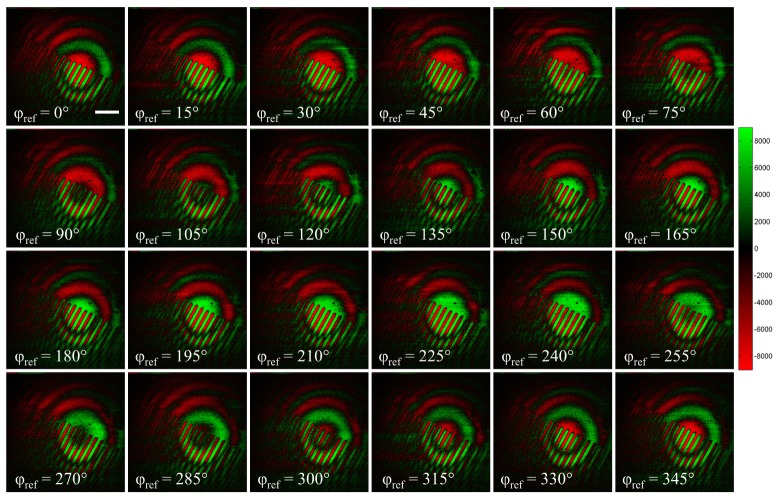
Fig. 2.
Subtraction stack obtained in PPLN sample. Red and green colors stand respectively for negative and positive values after the subtraction. Therefore, red and green colors reflect the sign of the cosine term in Eq. (1) and denote π phase shifted sample phase. Scale bar: 50µm.

