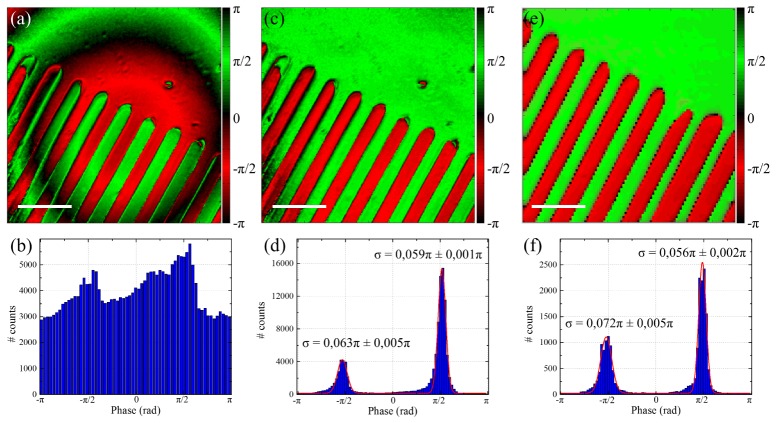
Fig. 4.
Phase correction in PPLN. Phase a) image and b) histogram measured in PLLN sample before correction. Phase c) image and d) histogram after correction of the phase shift introduced by the microscope. Phase e) image and f) histogram measured in PPLN sample using the former sample scanning I-SHG setup. The red straight lines in d) and f) are bi-Gaussian fittings of the phase distributions used to retrieve the peaks width σ. Scale bars: 25µm.

