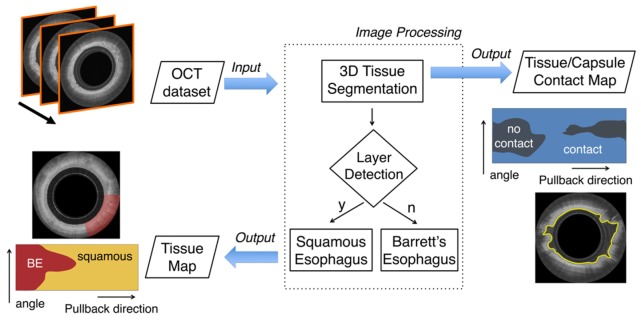
Fig. 2.
Flowchart of the entire automated processing framework. The algorithm receives as its input an entire OCT pullback data set that typically comprises >1,000 images. Initially, the algorithm automatically locates the position of the tissue’s surface over the entire 3D data set and then tissue characteristics are assigned. Squamous esophagus is differentiated from BE (with or without dysplasia) tissue by identifying the presence of horizontal layers. The output of the algorithm is a tissue map of the entire data set, automatically depicting the presence of BE and a contact map showing areas that lack contact between the capsule and the tissue.

