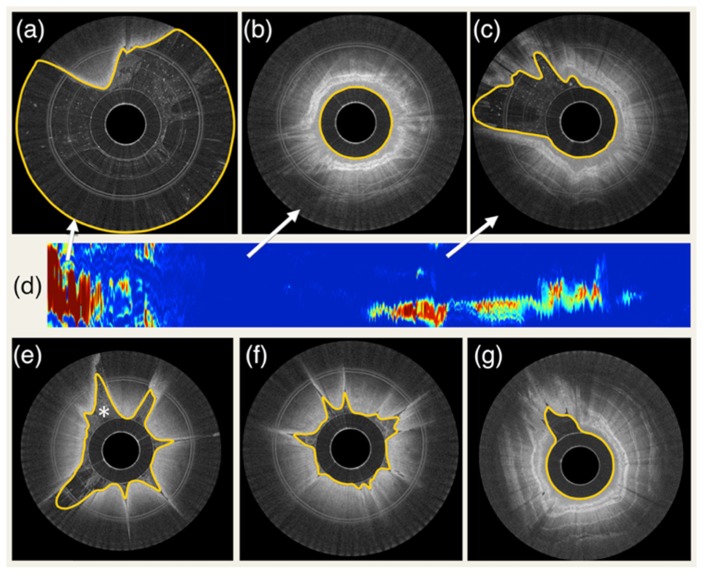
Fig. 5.
Example of segmentation results and tissue contact analysis. (a) capsule in the stomach with very low tissue contact, (b) capsule in the esophagus with complete contact, (c) capsule partially touching the esophageal wall (d) 2D contact map automatically generated by segmenting the entire data set. Colormap ranges from blue to red, where blue corresponds to full contact and red corresponds to no contact. (e) example of segmentation with the presence of intraluminal debris (indicated by *). (f) and (g) additional examples of fully automated segmentation results.

