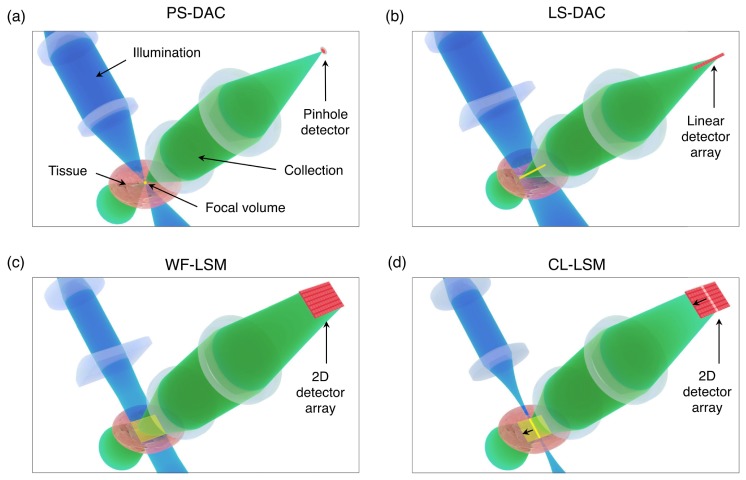
Fig. 1.
The illumination, collection, focal volume, and detector configurations for the PS-DAC, LS-DAC, WF-LSM, and CL-LSM microscope geometries. In (a), the PS-DAC geometry uses a moderate numerical aperture to illuminate a single point within the tissue, and a similar collection NA to image that point to a pinhole detector. In (b), the LS-DAC geometry uses a moderate illumination NA focused to a line, rather than a point within the tissue volume. This focal line is then imaged onto a linear detector array. In (c), the WF-LSM geometry uses a low illumination NA to provide a sheet of illumination (a low-NA line focus) within the tissue volume, which is imaged with a higher NA onto a two-dimensional (2D) image sensor. In (d), the CL-LSM geometry is shown, in which an illumination sheet identical to that in (c) is created over time by scanning a low-NA point-focused illumination beam, which is synchronized with the rolling shutter (line-by-line acquisition) of a 2D image sensor.

