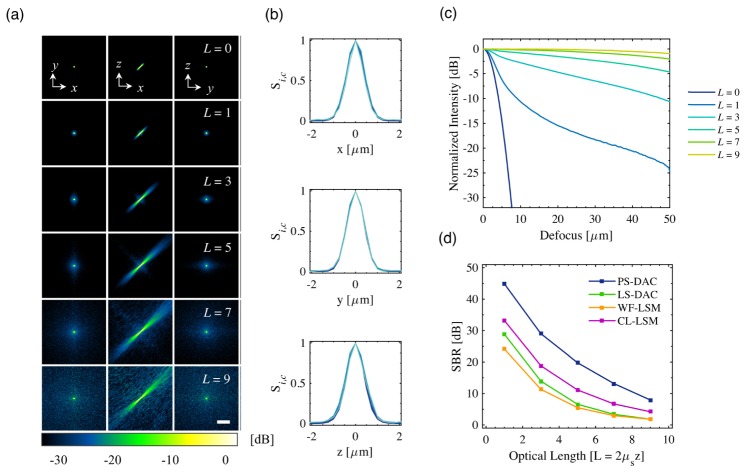
Fig. 5.
In (a), the PSFs, Si,c(x,y,z,L), are shown for the WF-LSM geometry. Each is self-normalized and displayed on a dB scale (10log10) down to −30 dB (10−3). In (b), the corresponding x, y, and z line profiles through the focus are plotted for each optical length, L. The corresponding axial scans Si,c(z,L) are shown in (c). In (d), the contrast (SBR) of the PS-DAC, LS-DAC, WF-LSM, and CL-LSM are plotted as a function of optical length. The scale bar in (a) represents 20 μm.

