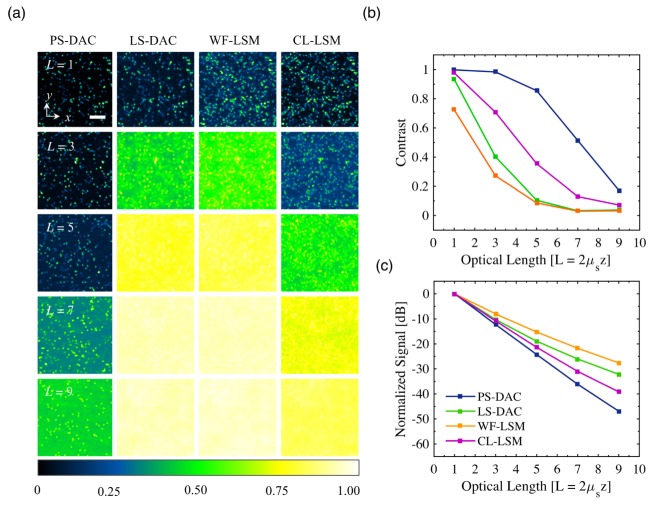
Fig. 6.
For each microscopy method, x-y sections of a fluorescent bead phantom, convolved with the appropriate PSF, are shown in (a), self normalized to a maximum value of 1.0. In (b) and (c), the calculated contrast of the images is plotted, as well as the decay in the peak signal of the PSFs as a function of optical length. The scale bar in (a) represents 20 μm.

