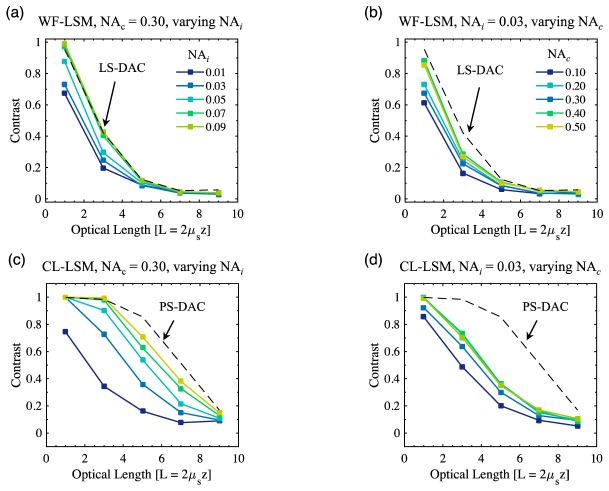
Fig. 7.
Image contrast values as a function of optical length in the fluorescent bead phantom are plotted for: (a) WF-LSM as a function of NAi for a fixed NAc = 0.30, (b) WF-LSM as a function of NAc for a fixed NAi = 0.03, (c) CL-LSM as a function of NAi for a fixed NAc = 0.30, (b) CL-LSM as a function of NAc for a fixed NAi = 0.03. For (a-b), the dashed line represents the performance of LS-DAC where NAi = NAc = 0.20, and in (c-d) the dashed line represents the performance of PS-DAC where NAi = NAc = 0.20.

