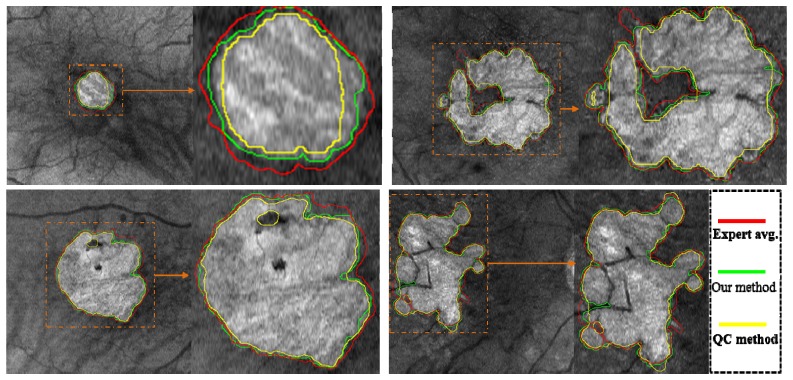
Fig. 12.
Segmentation results using the proposed method, QC’s method and average expert segmentation (considered as manual gold standard). The cases shown are the same as in Fig. 11 for direct comparison. The region of interest outlined in orange in each RSVP projection image is also shown zoomed in for larger detail. The color label for each segmentation method is indicated in the legend in the bottom right.

