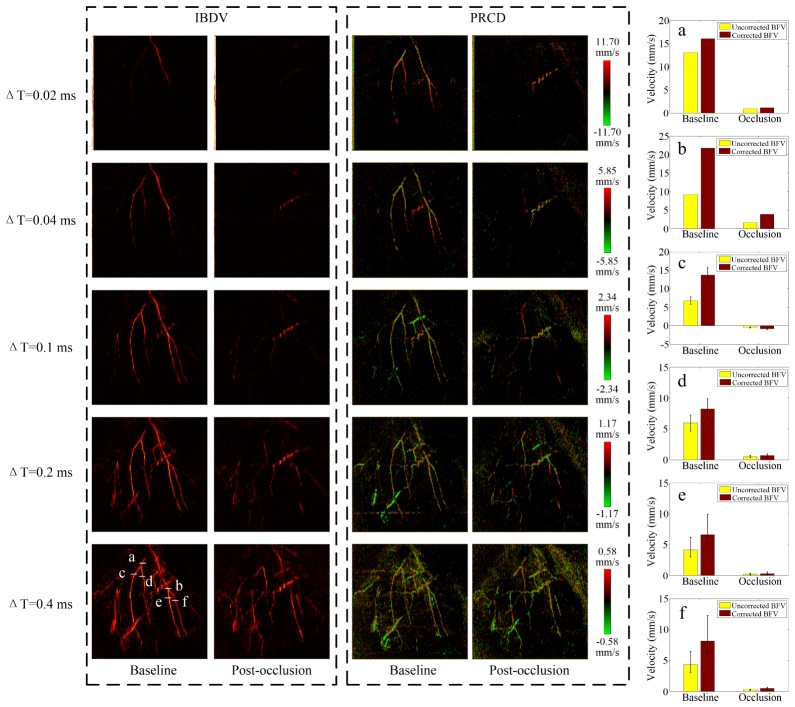
Fig. 11.
Images produced from adopting intensity variance method and Doppler method at baseline and post-occlusion with different time intervals. (a-f) Comparison of the blood flow velocities between baseline and post-occlusion at different vessel locations. The color bars represent the axial velocity range of the PRCD method.

