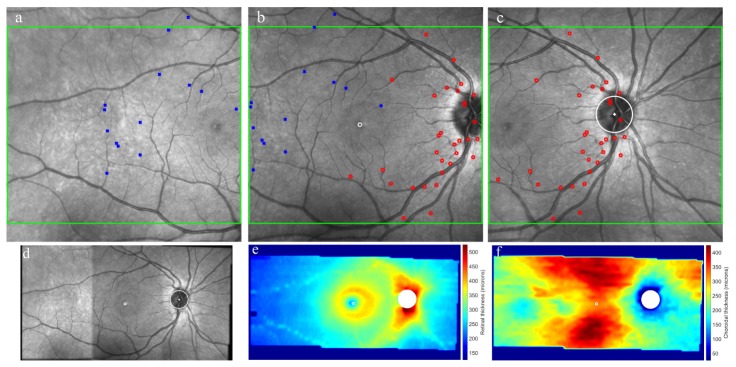
Fig. 2.
Example of a wide-field montage data analysis. SLO images (FOV 30° x 30°) from the spectral domain OCT captured at different retinal locations (a-temporal, b-central and c-nasal). The green box indicates the area covered by the OCT scans (FOV 30° x 25°), while the marks (blue square, red circles) show common features in the overlapping portions of the SLO images identified using the SIFT approach. The bottom row presents the resulting blended/registered data for the en-face SLO image (FOV 60° by 30°) (d) as well as its corresponding retinal thickness map (e) and choroidal thickness map (FOV 60° x 25°) (f). The thickness was calculated using the axial method.

