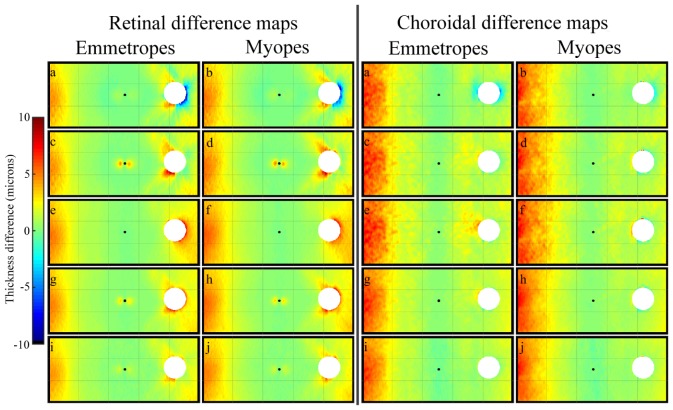
Fig. 8.
Group mean retinal (left subplots) and choroidal thickness difference maps (right subplots). Each group presents maps for emmetropes (left) and myopes (right) for the considered alternative thickness metrics, including the (a-b) normal, (c-d) layered normal, (e-f) minimum distance, (g-h) minimum distance averaged, (i-j) Laplace. For reference, the central fovea is marked with a circle while the optic nerve head (ONH) is masked from the analysis, given that no thickness data can be extracted within this region. The size of the ONH in the figure corresponds to the maximum ONH size of all subjects. Negative difference values indicate an underestimation of tissue thickness by the axial method compared to the alternative metric, while positive values indicate an overestimation.

