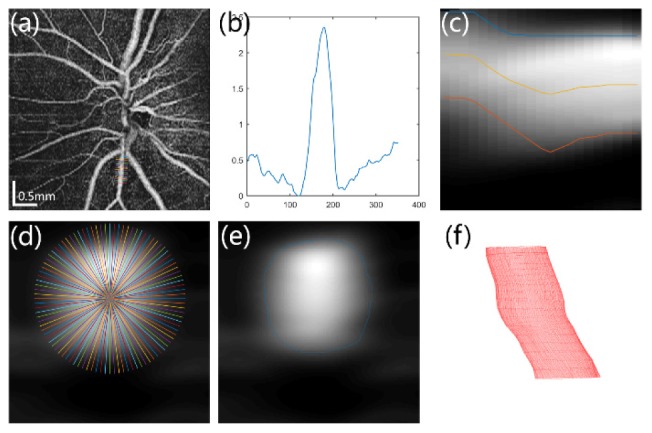
Fig. 3.

Diagram of 3D boundary detection for a retinal vessel. (a, b) Estimate of vessel diameter. (c) Estimate of vessel depth. (d) Illustration of resample and “unfolding” of 3D data set for retinal vessel. (e) Cross-section view of boundary detection results. (f) 3D visualization of vessel morphology.
