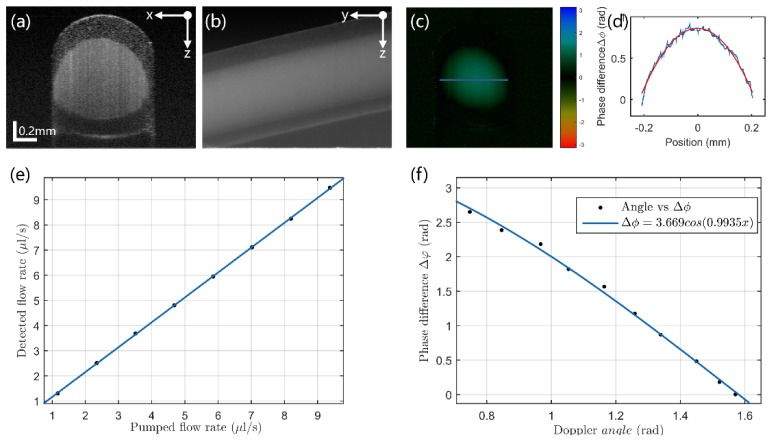
Fig. 4.
Validation of Doppler OCT. (a) OCT intensity image of the flow phantom at a Doppler angle of 77.4°. (b) Lateral projection of flow phantom at a Doppler angle of 77.4°. (c) Doppler OCT image corresponding to the intensity image in (a). (d) The blue line is the phase difference profile that is marked by the blue line in (c), and the red line is the result of parabolic fitting. (e) Comparison between pumped flow and detected flow with the fixed Doppler angle. (f) Validation of relationship between Doppler angle and phase difference with fixed pumped flow.

