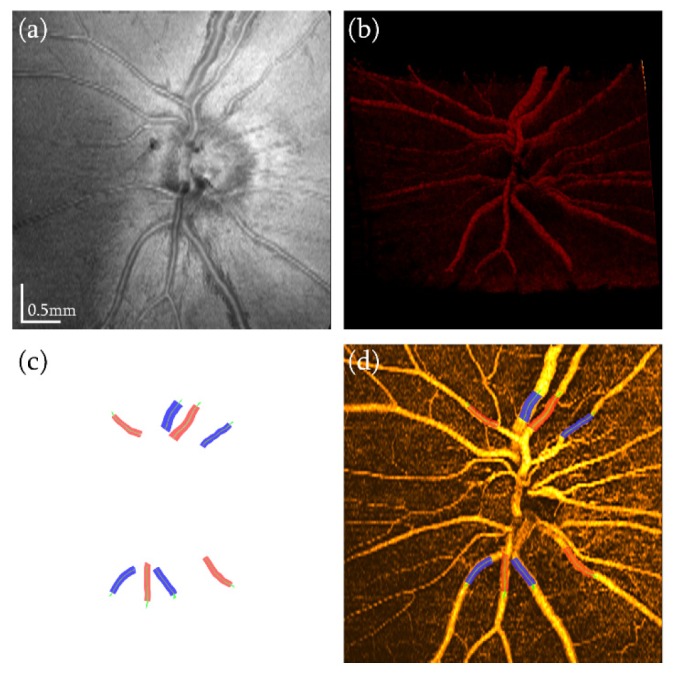
Fig. 6.

OCT angiography and three-dimensional segmentation of retinal vessels on the optic disc. (a) En face view of the intensity image and the OCT angiography image. (b) Rendered 3D volume of OCT angiography. (c) 3D reconstruction of the selected vessels. The green lines indicate the center of each vessel. The red color indicates arteries and blue color indicates veins. (d) OCT angiography image overlayed with boundaries of the reconstructed vessels.
