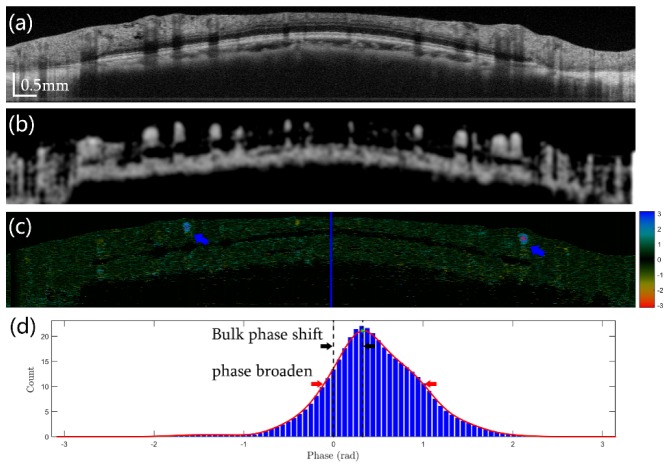
Fig. 7.
Comparison between OCT angiography and Doppler OCT. (a) Intensity image of optic disk area with circular scan. (b) OCT angiography image and (c) Doppler image in which two vessels required phase unwrapping (blue arrows). (d) Averaged shifted histogram of the A-scan marked by the blue line in (c). The black arrows indicate bulk phase shift and red arrows indicate phase noise of the in vivo retina.

