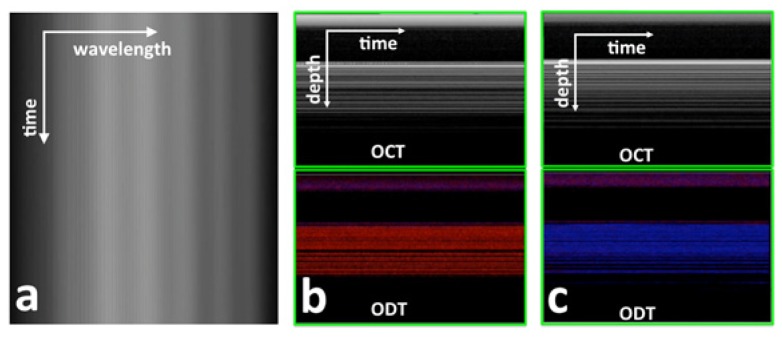
Fig. 5.
(a) A frame of interferometric spectrum obtained when the probe was used to exert force (Visualization 1 (904.2KB, MP4) ); (b) structural OCT image (upper) and Doppler OCT image (lower) obtained when the phantom was compressed by the qOCE probe (Visualization 2 (2.6MB, MP4) ); (b) structural OCT image (upper) and Doppler OCT image (lower) obtained when the compression was released (Visualization 3 (2.2MB, MP4) ).

