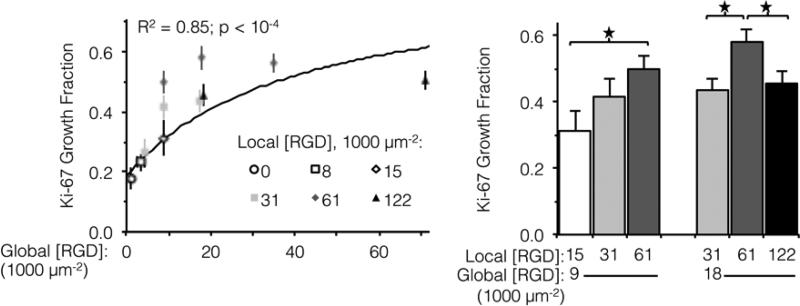
Figure 3.
Fraction of actively dividing cells as a function of global and local ligand densities. (Left panel) Scatterplot of Ki-67 growth fraction versus global ligand density. (Right panel) Bar chart highlighting statistically significant differences due to ligand clustering at specified global densities. Growth fraction increased with respect to global ligand density (n = 300 cells, two independent cultures per condition); a hyperbolic trend (solid line) was fit to data from fabrics with ligands on every fiber (R2 = 0.85, p < 10−4). Local ligand clustering to 61,000 RGD μm−2 enhanced cell division at both 9,000 and 18,000 RGD μm−2 global densities, but further clustering to 122,000 RGD μm−2 inhibited cell division. * p < 0.05.

