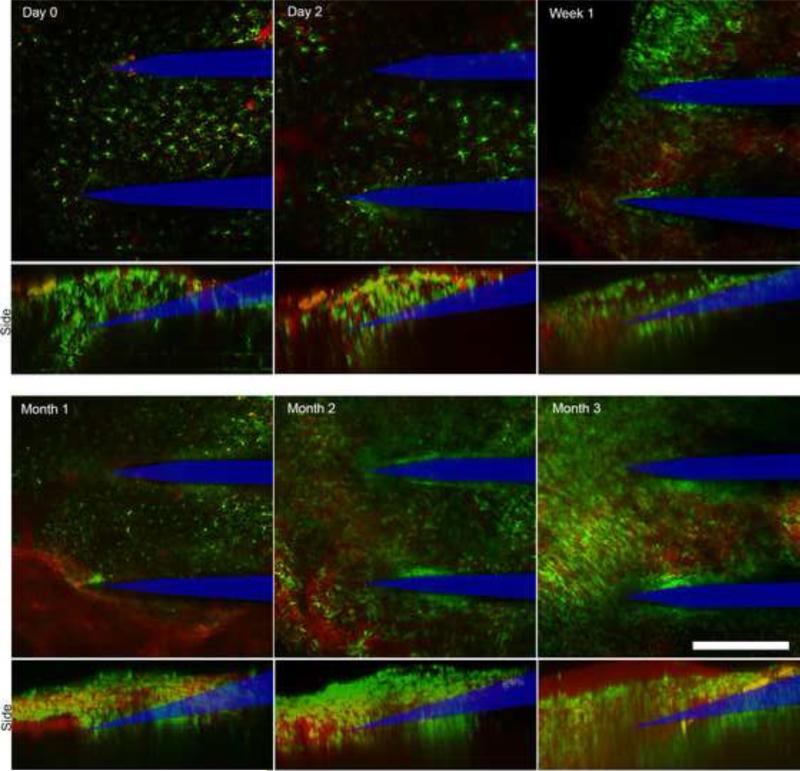
Figure 8.
Imaging through in vivo cranial window over three months. Probe tips observable through tissue at all time points, with clear morphology of surrounding monocytes. Bottom panels: 3D projections of Z-stacks reveal growth of fibrous tissue at the cortical surface (neural probe profile denoted by blue line). Scale bar = 150 μm.

