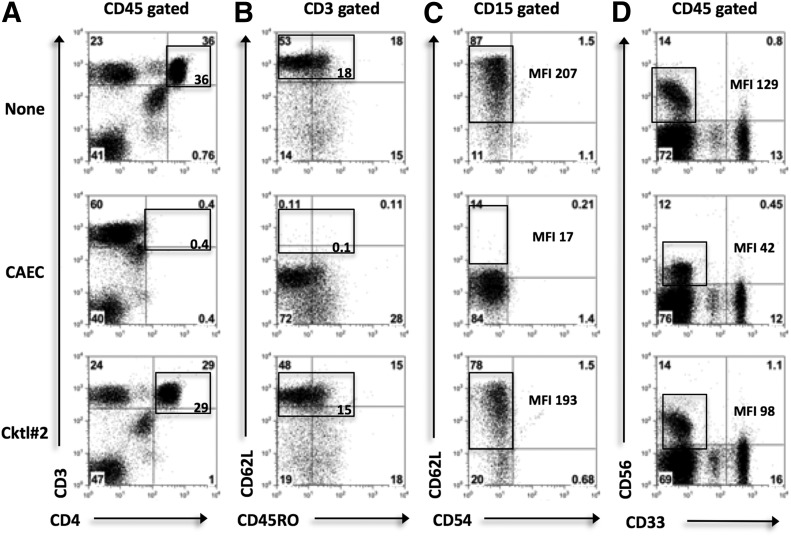
Figure 4. The effect of enzymatic exposure on HD peripheral blood leukocyte surface markers.
PBMCs and PBNs were incubated with PBS [control (None)], Cocktail #2 (Coll I, II, IV), or CAEC for 30 min. Lymphocyte, myeloid, and NK cell-surface markers were then analyzed by use of flow cytometry. Statistical analysis was performed with one-way ANOVA. (A–D) Representative dot plots displaying the expression levels of CD4, CD62L on CD3+ cells, CD62L on CD15+ cells, and CD56, CD33 on CD45+ cells, respectively. One of 5 experiments is shown. Expression levels are marked in each gate, and MFIs are displayed where appropriate. Control marker expression was used as a baseline.

