Fig. 3.

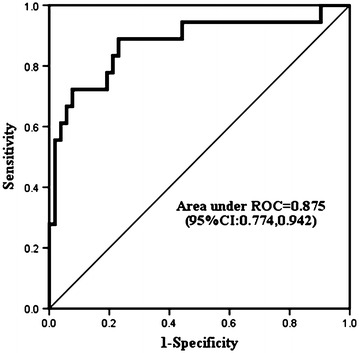
ROC curve analysis of plasma levels of AOPPs measured at 1 h after operation. The area under the curve was 0.875 (95 % CI 0.774, 0.942)

ROC curve analysis of plasma levels of AOPPs measured at 1 h after operation. The area under the curve was 0.875 (95 % CI 0.774, 0.942)