
Fig. 2.
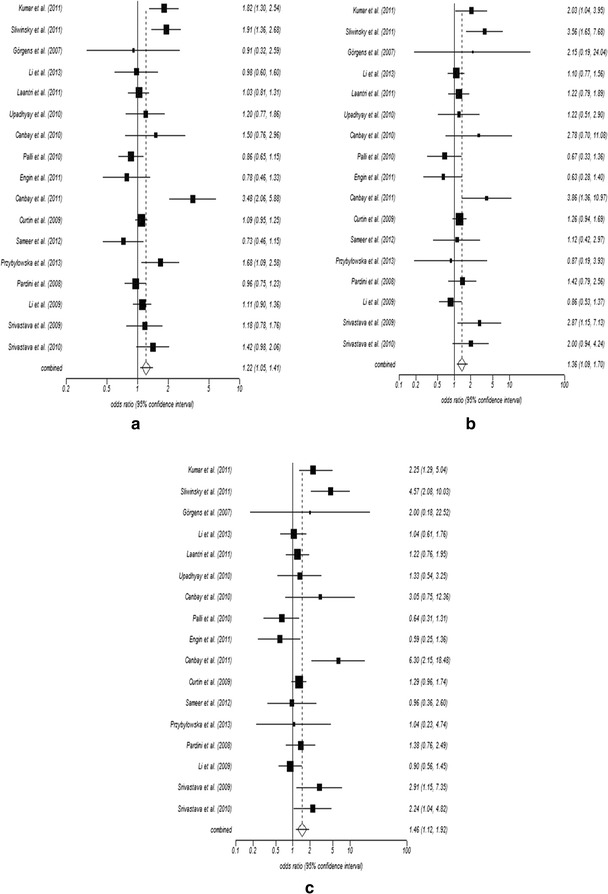
Figure showing forest plots of OGG1 Ser326Cys polymorphism in association with upper aero-digestive tract cancer and gastro-intestinal cancer for all the three models: a dominant model, CG + GG versus CC, b recessive model, CG + CC versus GG, c homozygous model, GG versus CC