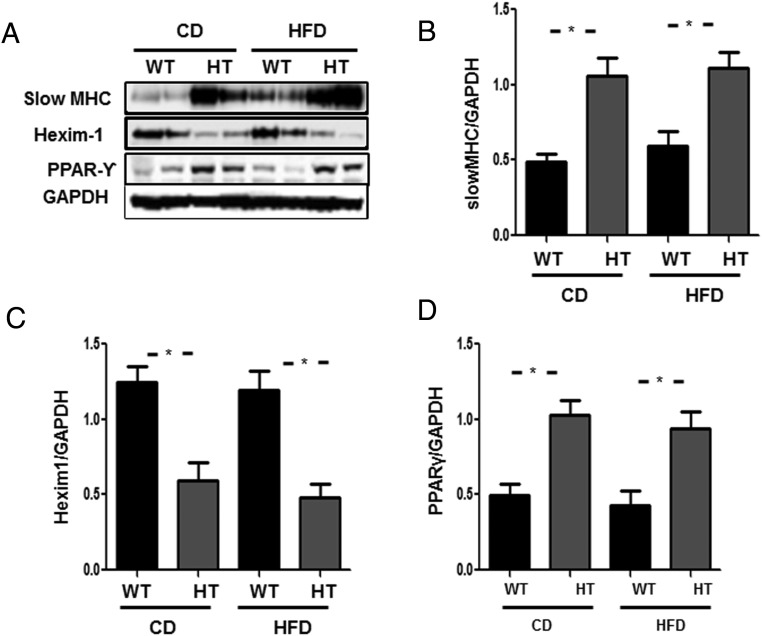
Figure 4.
Changes in the expression of transcription factors regulating metabolic response in gastrocnemius muscle of HT mice. A, Western blotting of gastrocnemius muscle total protein extract (from quadruplicate experiments) of WT, and heterozygous (HT) fed chow or HFD for 14 weeks. B, Graphs showing data quantification of sMHC to GAPDH ratio in WT vs HT fed chow or HFD showing increased expression of sMHC in the HT background in both diets. C, Graphs showing data quantification of Hexim1 to GAPDH ratio in WT vs HT fed chow or HFD showing decreased expression of Hexim1 in the HT background in both diets. D, Graphs showing data quantification of PPARγ to GAPDH ratio in WT vs HT fed chow or HFD showing increased expression of PPARγ in both diets. Data quantification is represented by the mean ± SEM; *, P < .05 obtained by one-way ANOVA followed by Bonferroni's post hoc test.

